gnuplot is Super Handy
Yesterday I wanted to graph some data by date but I didn’t want to mess with spreadsheet software or other graphing libraries. I reached for gnuplot after hearing good things over the years. The results were great.
At work we are migrating our logging infrastructure, which requires reimplementing various bits of monitoring. Yesterday I was pushing out tooling to check the progress of the local log collector (filebeat.) When I first ran the tool I saw that we had a very high backlog on one host (over three gigs) but I wanted to see how long it was taking. The numbers were noisy enough that I figured a graph would make it more clear.
So first, I wrote a little shell script to log data points:
while true; do
   sleep 10
   perl -e'print scalar localtime . "\t" . time . "\t"'
   calc $(sudo ./filebeat.py -b ) / 1024 / 1024
done | tee -a progress.txt
(Note that calc ships with my standard
kit).
Next, I whipped up a gnuplot program to parse and graph the data:
#!/usr/bin/gnuplot

reset

# Write png to stdout
set terminal png

# X axis is time
set xdata time

# Parse X value as unix epoch
set timefmt "%s"

# Format X value as minutes past the hour
set format x "%M"

set xlabel "Time"
set ylabel "Megs remaining"

set title "Backlog"
set key below
set grid

# 1:2 is how to map the columns in the data to the graph
plot "./short.csv" using 1:2 title "megs"
Comments are inline.
Finally I ran this little script to copy the data to my laptop, munge it slightly, graph, and display it:
scp $SERVER:progress.txt eg.csv
cat eg.csv | cut -f2-3 > short.csv
gnuplot foo.plot > foo.png
feh foo.png
The resulting graph is included below:
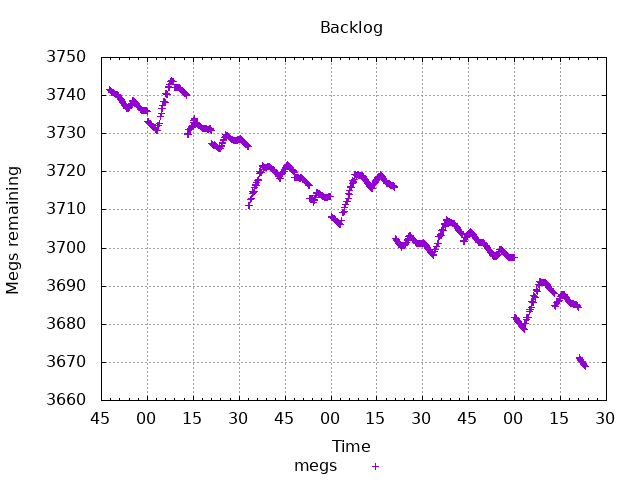
It was pretty cool to be able to write the above (all of it) in about ten minutes. Obviously I let the data logger run for a few hours, which should be clear from the graph. Unfortunately filebeat is shipping less than two megabytes per minute! That’s the next problem to solve, once the monitoring is all in place.
I have clearly not used gnuplot for long, but I am enamored and intend to learn more. Here are a couple books I will get by and by, which have good reviews and are relevant:
(The following includes affiliate links.)
We’ll see if I have more to say when I get there, but at the very least, being able to graph time series data without complex code like this is quite lovely.
Posted Fri, Feb 16, 2018If you're interested in being notified when new posts are published, you can subscribe here; you'll get an email once a week at the most.