Leatherman Draw
I wrote a weird little tool to draw stuff with code. It was fun!
I decided a little while ago to build a tool for my leatherman to generate images. It’s inspired by the image drawing in PICO-8. Let’s dive in!
Wiring the main body of the tool was pretty easy overall, I used the image,
image/color, image/png, math, and github.com/yuin/gopher-lua packages
in pretty straightforward ways.
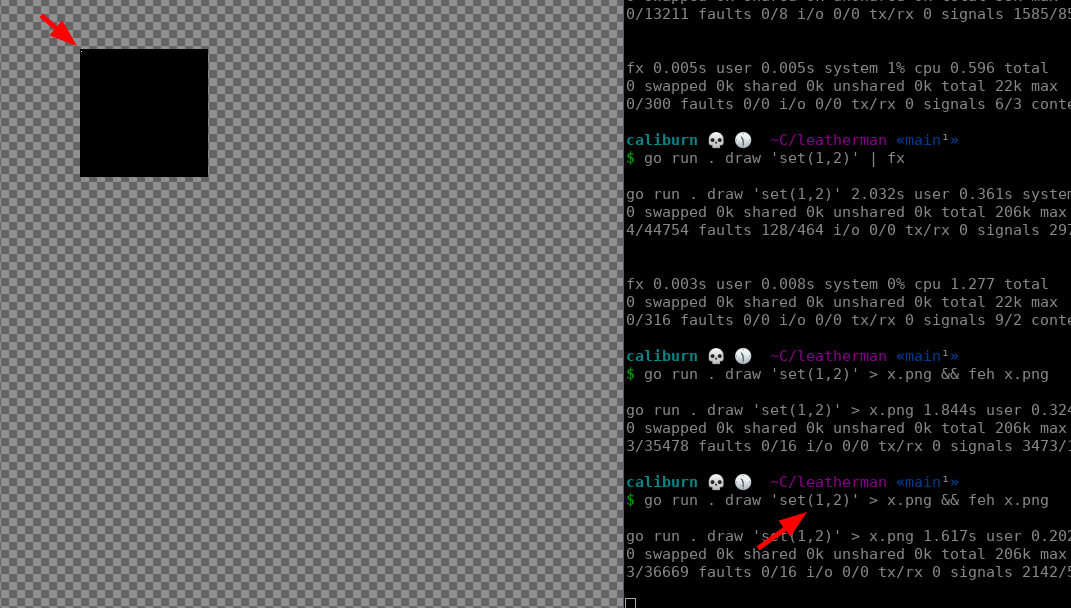
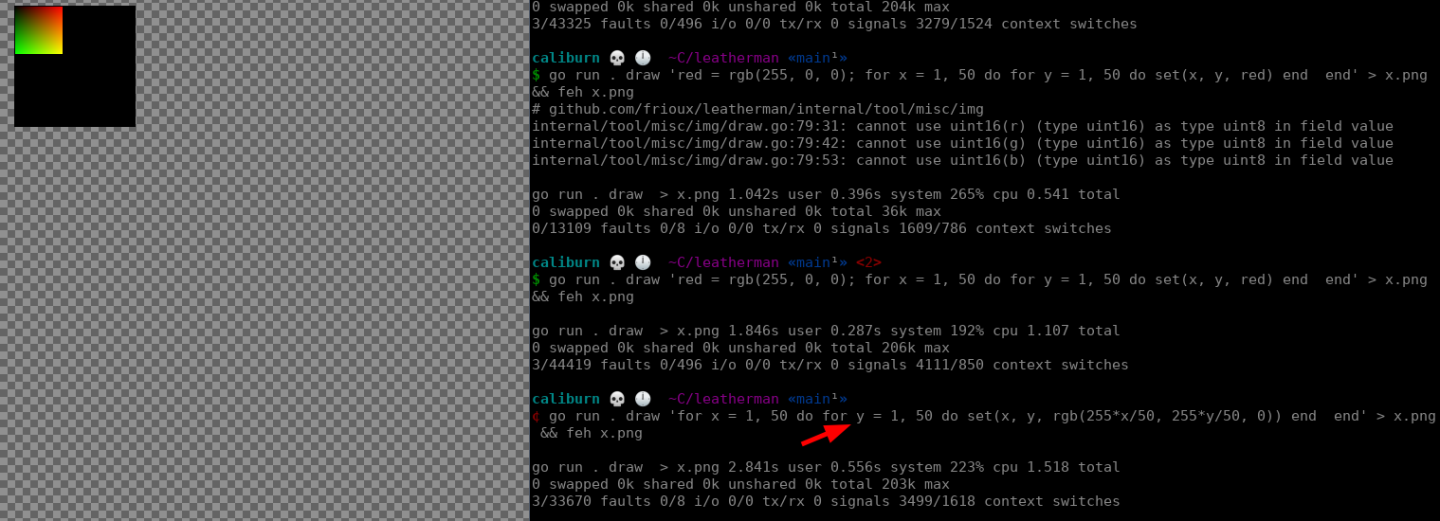
Here are some screenshots of me getting it to work:

🔗 Lines
The main difficulties I started off with were massive performance issues due to
terrible code! Let’s start with line. The following is the code I
started
with plus some comments to point out the egregious mistakes I made.
line := func(x1, y1, x2, y2 float64, c color.Color) {
	m := (y2 - y1) / (x2 - x1)
	// y = m*x + b
	// y - m*x = b
	// b = y - m*x
	b := y1 - m*x1
	// keep reading, the use of l is so silly
	l := math.Sqrt(math.Pow(x2-x1, 2) + math.Pow(y2-y1, 2))
	if m == math.Inf(1) || m == math.Inf(-1) { // checked for Inf instead of just seeing if y1 == y2
		start, end := y1, y2
		if start > end {
			start, end = end, start
		}
		for y := start; y <= end; y += l / 1000 { // frew why are there always 1000 steps?
			img.Set(int(math.Round(x1)), int(math.Round(y)), c)
		}
	} else {
		start, end := x1, x2
		if start > end {
			start, end = end, start
		}

		for x := start; x <= end; x += l / 1000 { // yet another thousand, for reasons
			y := m*x + b // this is sane, but not great
			img.Set(int(math.Round(x)), int(math.Round(y)), c)
		}
	}
}
Ok so the above is not great. If you draw a line from (0, 0) to (0, 1) it will do 1000 iterations of the second for loop. Silly.
So I read the wikipedia page for Bresenham’s line algorithm. For silly reasons: I read it, understood it, and implemented an algorithm inspired by it but likely not quite as good as it could be. Here’s the new version, with some added comments to explain the improvements:
line := func(x1, y1, x2, y2 float64, c color.Color) {
	// special case horizontal and vertical lines for better performance
	if math.Round(x1) == math.Round(x2) {
		for y := y1; y < y2; y++ {
			img.Set(int(math.Round(x1)), int(math.Round(y)), c)
		}
		return
	} else if math.Round(y1) == math.Round(y2) {
		for x := x1; x < x2; x++ {
			img.Set(int(math.Round(x)), int(math.Round(y1)), c)
		}
		return
	}

	m := (y2 - y1) / (x2 - x1)

	// depending on the slope, use x or y for dependent variable.
	// This is really important!  If you get this wrong you get
	// really weird graphs.  I'll include a screenshot below and describe
	// why.
	if m >= -1 && m <= 1 {
		y := y1
		start, end := x1, x2
		if start > end {
			start, end = end, start
			y = y2
		}

		// b is gone; we just start at the start
		for x := start; x <= end; x++ {
			img.Set(int(math.Round(x)), int(math.Round(y)), c)
			// Instead of recalculating for each run, just add the
			// slope!  Possibly more rounding errors but way, way
			// faster.
			y += m
		}
	} else {
		// see above comments, basically the same here.
		m1 := (x2 - x1) / (y2 - y1)
		x := x1
		start, end := y1, y2
		if start > end {
			start, end = end, start
			x = x2
		}

		for y := start; y <= end; y++ {
			img.Set(int(math.Round(x)), int(math.Round(y)), c)
			x += m1
		}

	}
}
🔗 Circles
The next crappy code issue I had was drawing circles. Initially this was bad because my line drawing was really bad. I would have shown these screenshots in the previous section but they were in the context of circles when I was debugging. Here are a couple examples:
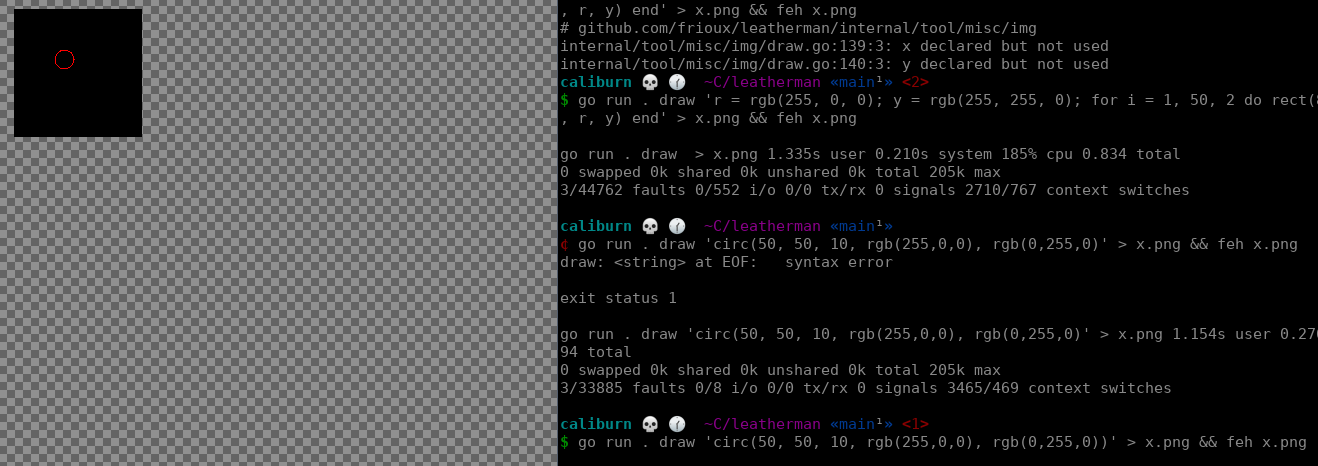
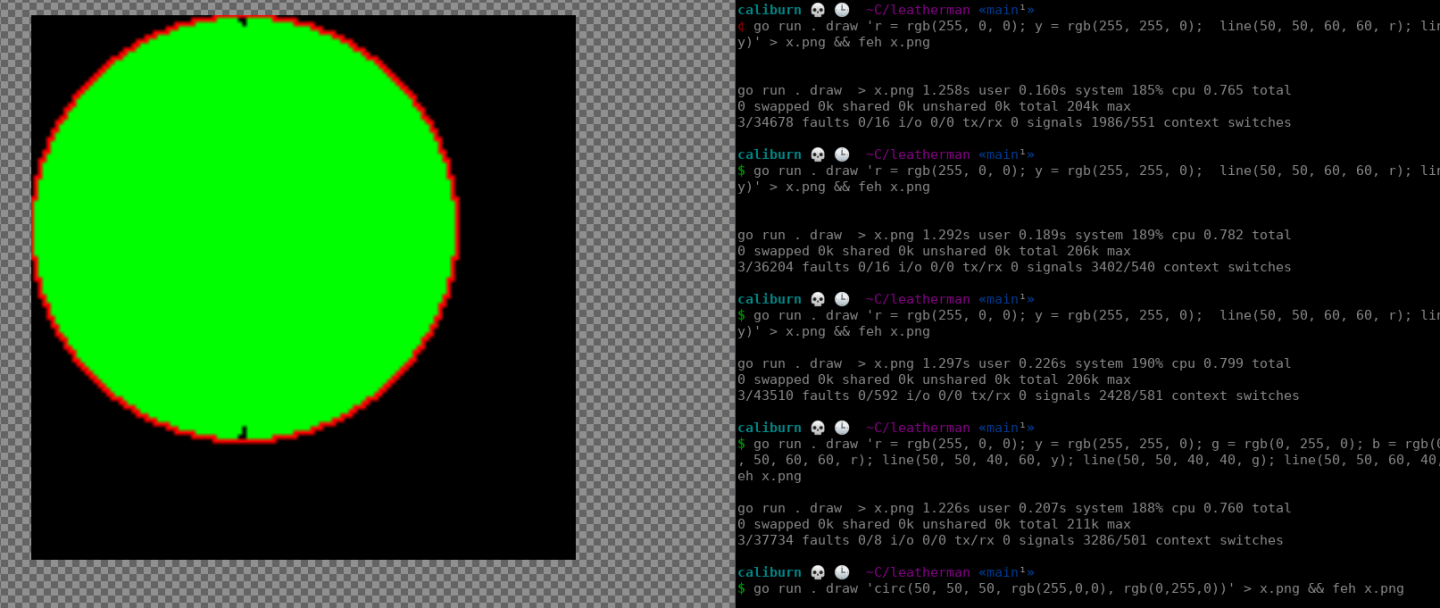
So the above is bad. It doesn’t look too bad, with just a couple notches out of the circles, but on my Raspberry Pi 2 it takes 14 seconds to render a small circle. Here’s my naive code, again with comments of some silly mistakes:
L.SetGlobal("circ", L.NewFunction(func(L *lua.LState) int {
	x := int(L.CheckNumber(1))
	y := int(L.CheckNumber(2))
	r := float64(L.CheckNumber(3))
	border := checkColor(L, 4)
	fill := checkColor(L, 5)

	// I am doing over a thousand iterations for a circle with a radius of 20.  Not great!
	for t := 0.0; t < 2*math.Pi*r; t += 0.1 /* uhh */ {
		xt := r*math.Cos(t) + float64(x)
		yt := r*math.Sin(t) + float64(y)

		// drawing lines from the center out makes some sense
		// but ends up leaving gaps here and there
		line(float64(x), float64(y), xt, yt, fill)
		img.Set(int(math.Round(xt)), int(math.Round(yt)), border)
	}
	return 0
}))
While I debugged line drawing, here are some buggy circles I drew:
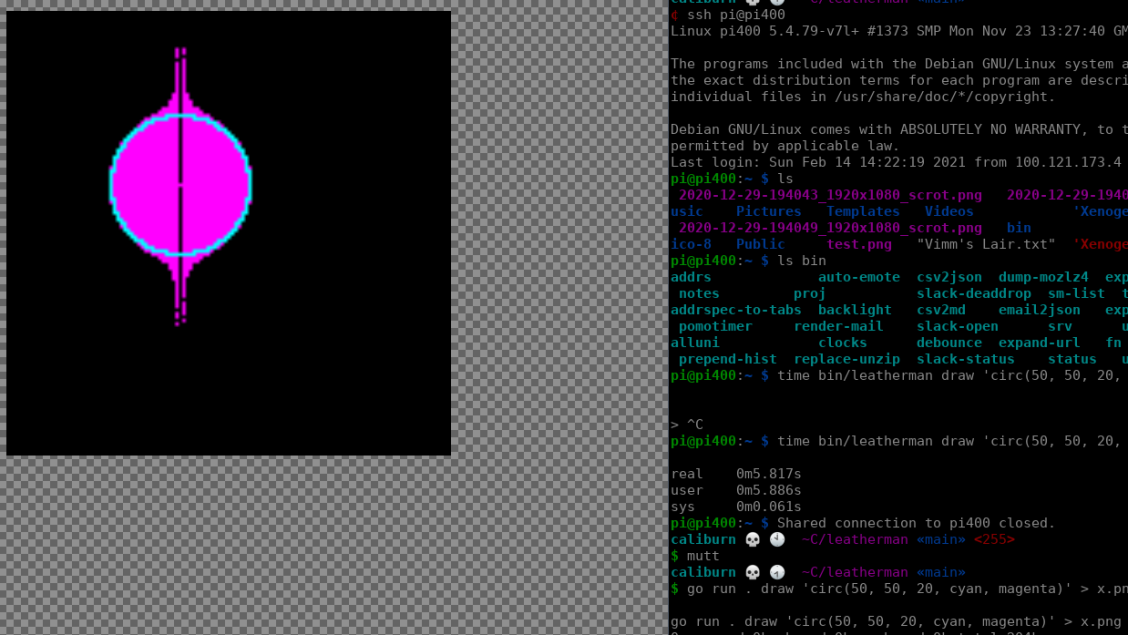
(I actually think the above looks really cool, and stored the code in a branch so I could reproduce it directly later.)
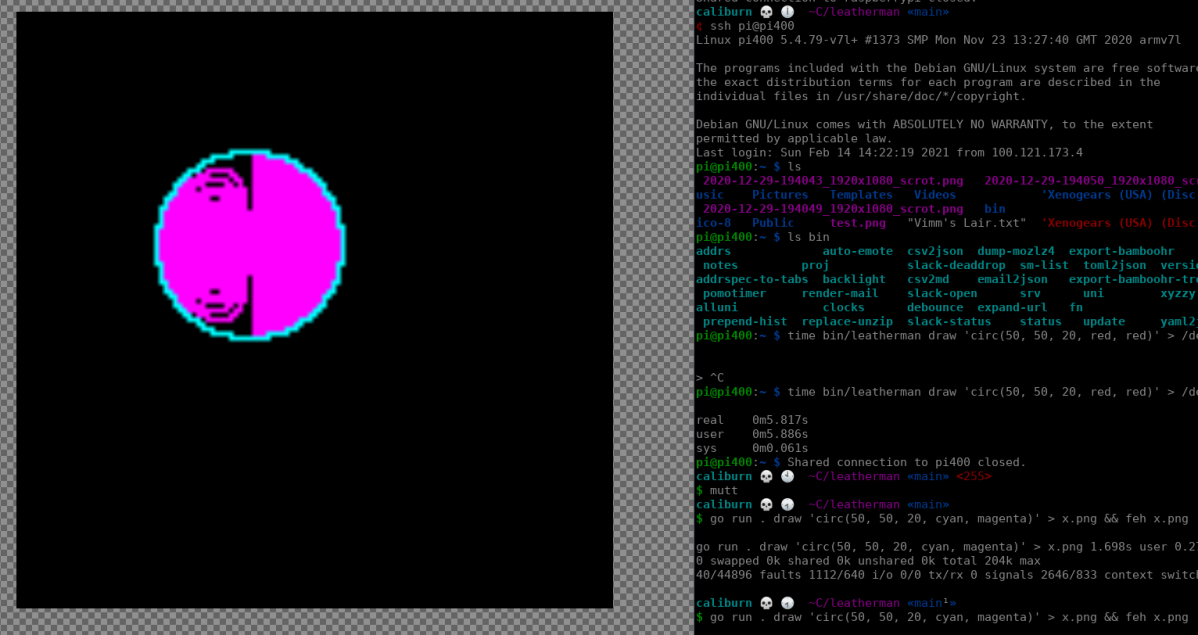
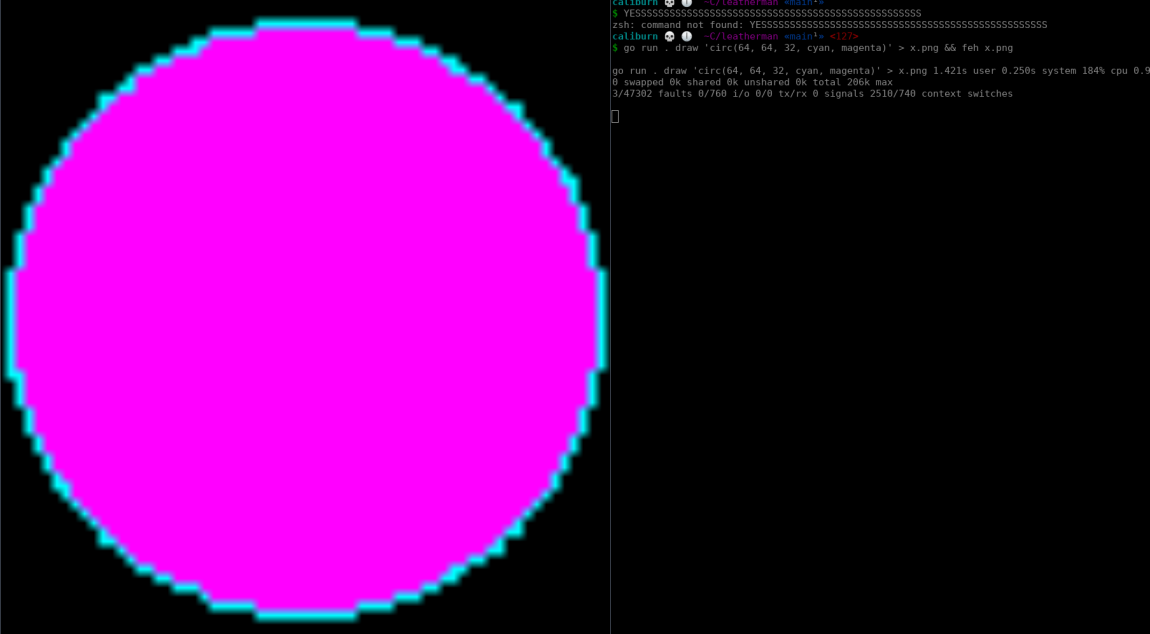
This was tricky to fix, but before I show you how I fixed it, I’ll show you the corrected algo, and a working image.
L.SetGlobal("circ", L.NewFunction(func(L *lua.LState) int {
	xc := int(L.CheckNumber(1))
	yc := int(L.CheckNumber(2))
	r := float64(L.CheckNumber(3))

	border := checkColor(L, 4)
	fill := checkColor(L, 5)

	for x := int(-r); x <= int(r); x++ {
		for y := int(-r); y <= int(r); y++ {
			if x*x+y*y <= int(r*r) { // check if inside cirlce, rather than drawing a line
				img.Set(x+xc, y+yc, fill)
			}
		}
	}

	// improve with http://weber.itn.liu.se/~stegu/circle/circlealgorithm.pdf
	for t := 0.0; t < 2*math.Pi; t += 1 / r {
		xt := r*math.Cos(t) + float64(xc)
		yt := r*math.Sin(t) + float64(yc)

		img.Set(int(math.Round(xt)), int(math.Round(yt)), border)
	}

	return 0
}))
🔗 debugging
So the circle issues above were killing me. My friend Wes suggested that I generate a gif to allow debugging. So I did that! It was pretty easy. Here’s the code for the gif generation:
debugDraw := func(string, image.Image) error { return nil }
cleanup = func() error { return nil }

if d := os.Getenv("LM_DEBUG_DRAW"); d != "" {
	dgif := &gif.GIF{}
	shouldDebug := regexp.MustCompile(d)
	e, err := os.Create("debug.log")
	if err != nil {
		panic(err)
	}

	debugDraw = func(name string, img image.Image) error {
		if !shouldDebug.MatchString(name) {
			return nil
		}

		fmt.Fprintln(e, name)
		frame := image.NewPaletted(img.Bounds(), palette)
		draw.Over.Draw(frame, img.Bounds(), img, image.Point{})
		dgif.Image = append(dgif.Image, frame)
		dgif.Delay = append(dgif.Delay, 1) // 10ms, minimum delay
		return nil
	}
	cleanup = func() error {
		defer e.Close()
		f, err := os.Create("debug.gif")
		if err != nil {
			return err
		}
		defer f.Close()

		if err := gif.EncodeAll(f, dgif); err != nil {
			return err
		}

		return nil
	}
}
An important detail is that the LM_DEBUG_DRAW env var is a regular expression matching
something related to what we want to debug. So at the time I was debugging this you could
debug entire lines, for example, by setting it to line (or . to debug everything.)
So the first problem I had was that I was accidentally drawing around the circle more than once. This was perfectly clear thanks to my first gif:

(This gif seems to do nothing for a long time. This is actually a big part of the problem. It has many frames and loops forever, but a lot of the frames are subtle or literally do nothing.)
After fixing the duplicates loops, here’s a zoomed in circle gif:

When the image above is drawn, there is a related logline. Using that logline I was able to find one of the problematic lines. Rendering it made the problem instantly clear:
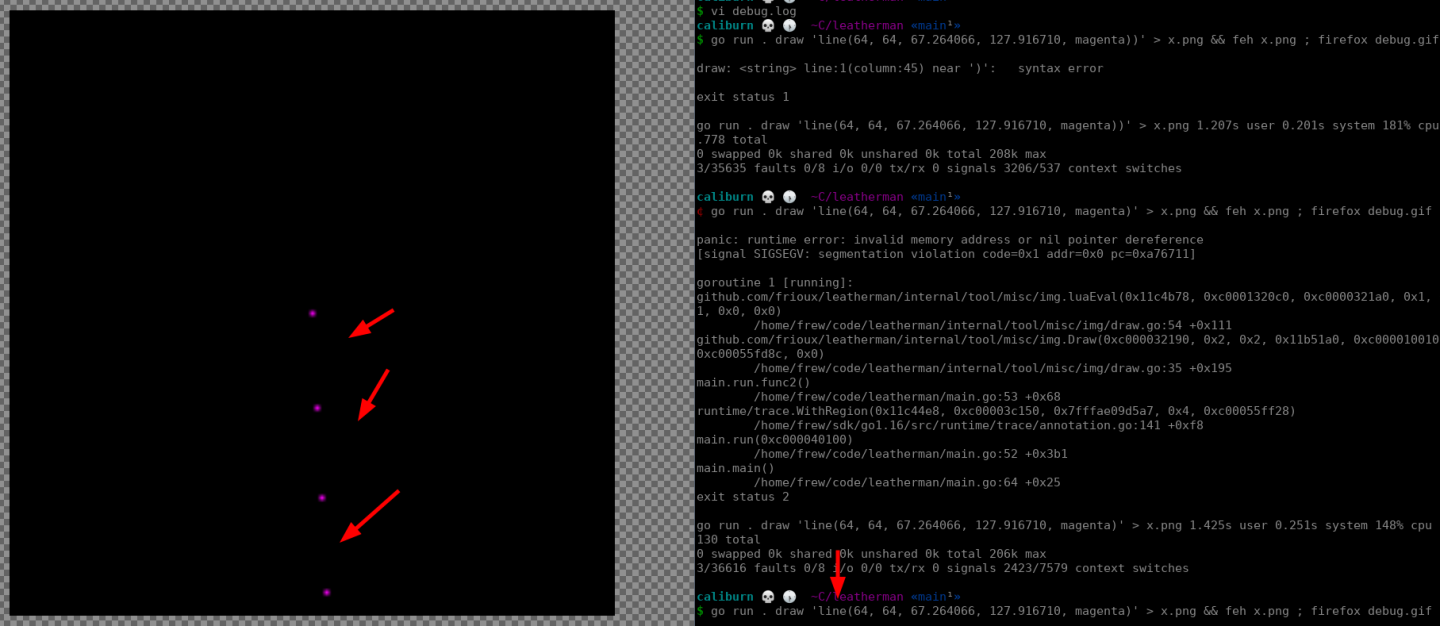
The problem is that with the better algorithm, we start at x1 and add 1 for each run through the loop. This means that if the slope is too high (or too low) there will be gaps, as seen above.
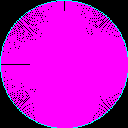
After fixing the line bugs I can draw a 360 degree arc (circles are special cased for the moment) and they look much better (though still clearly not perfect:)
🔗 Examples in Action
After getting this thing mostly working, I started playing with it. I wired it up to discord so that any lua will get evaluated by the bot and become an image. This became very fun to play with in a kind of performative style.
Here are some fun examples, with code before the image:
for t = 0, 64, 0.01 do
   set(64+sin(t)*t, 64+cos(t)*t, rgb(255, t*5, 0))
end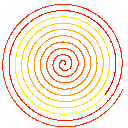
require "math"
for x = 0, 128 do
  for y = 0, 128 do
     color = math.random()
     set(x, y, rgb(color, color, color))
  end
end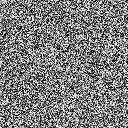
My friend Wes came up with the following one:
require "math"
for x = 0, 128 do
  for y = 0, 128 do
     set(x, y, rgb(math.random(), math.random(), math.random()))
  end
end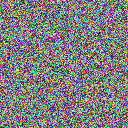
require "math"
for x = 0, 128 do
  for y = 0, 128 do
     r = 255*x/128*math.random()
     g = x/128*255*math.random()
     b = 255*math.random()
     set(x, y, rgb(r, g, b))
  end
end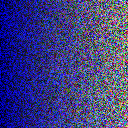
rect(0, 0, 128, 128, black, black)
for t = 0, 64, 0.01 do
   x = 64+sin(t)*cos(t)*t
   y = 64+sin(t)*t
   set(x, y, rgb(255, x/128*255, y/128*255))
end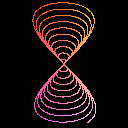
This was very fun to build. There’s plenty that could improve. There are still some subtle bugs in the line drawing, which makes arcs look bad. I might write some tests and some benchmarks at some point. One major feature I think is lacking which is logical transparency, ie do not paint a pixel, (as opposed to painting a transparent pixel.)
(Affiliate links below.)
Recently Brendan
Gregg’s Systems Performance got its second edition released. He wrote about it
here.
I am hoping to get a copy myself soon. I loved the first edition and think the
second will be even more useful.
At the end of 2019 I read
BPF
Performance Tools.
It was one of my favorite tech books I read in the past five years. Not only
did I learn how to (almost) trivially see deeply inside of how my computer is
working, but I learned how that works via the excellent detail Gregg added in
each chapter. Amazing stuff.
If you're interested in being notified when new posts are published, you can subscribe here; you'll get an email once a week at the most.